VSO vs. IVV: Which Indicator to Use, for What Period, and What Neither Measures
VSO and IVV are Brazilian real estate indicators associated with sales and available supply. Neither label defines a universal formula or proves equivalence…
Imovitec · September 24, 2026
VSO and IVV are Brazilian real estate indicators associated with sales and available supply. Neither label defines a universal formula or proves equivalence. The applicable meaning comes from the specific publication, after its period, geography, sample, numerator and denominator are checked.
For a market intelligence team, this distinction affects monthly reporting, development comparisons and 12-month trend analysis. Familiar acronyms may hide different rules for inventory, launches, cancellations and market coverage. As a result, percentages that look alike may answer different questions.
Key takeaways
Within the scope documented by the publisher, VSO and IVV can inform sales and supply analysis. The crucial point is methodological: analysts should retain the original geography, period and calculation rules, separate incompatible series, and avoid drawing conclusions about prices, returns, causes or individual selling times from unit-based ratios.
- VSO and IVV are not proven universal synonyms.
- The methodology of the selected publication determines what each indicator means.
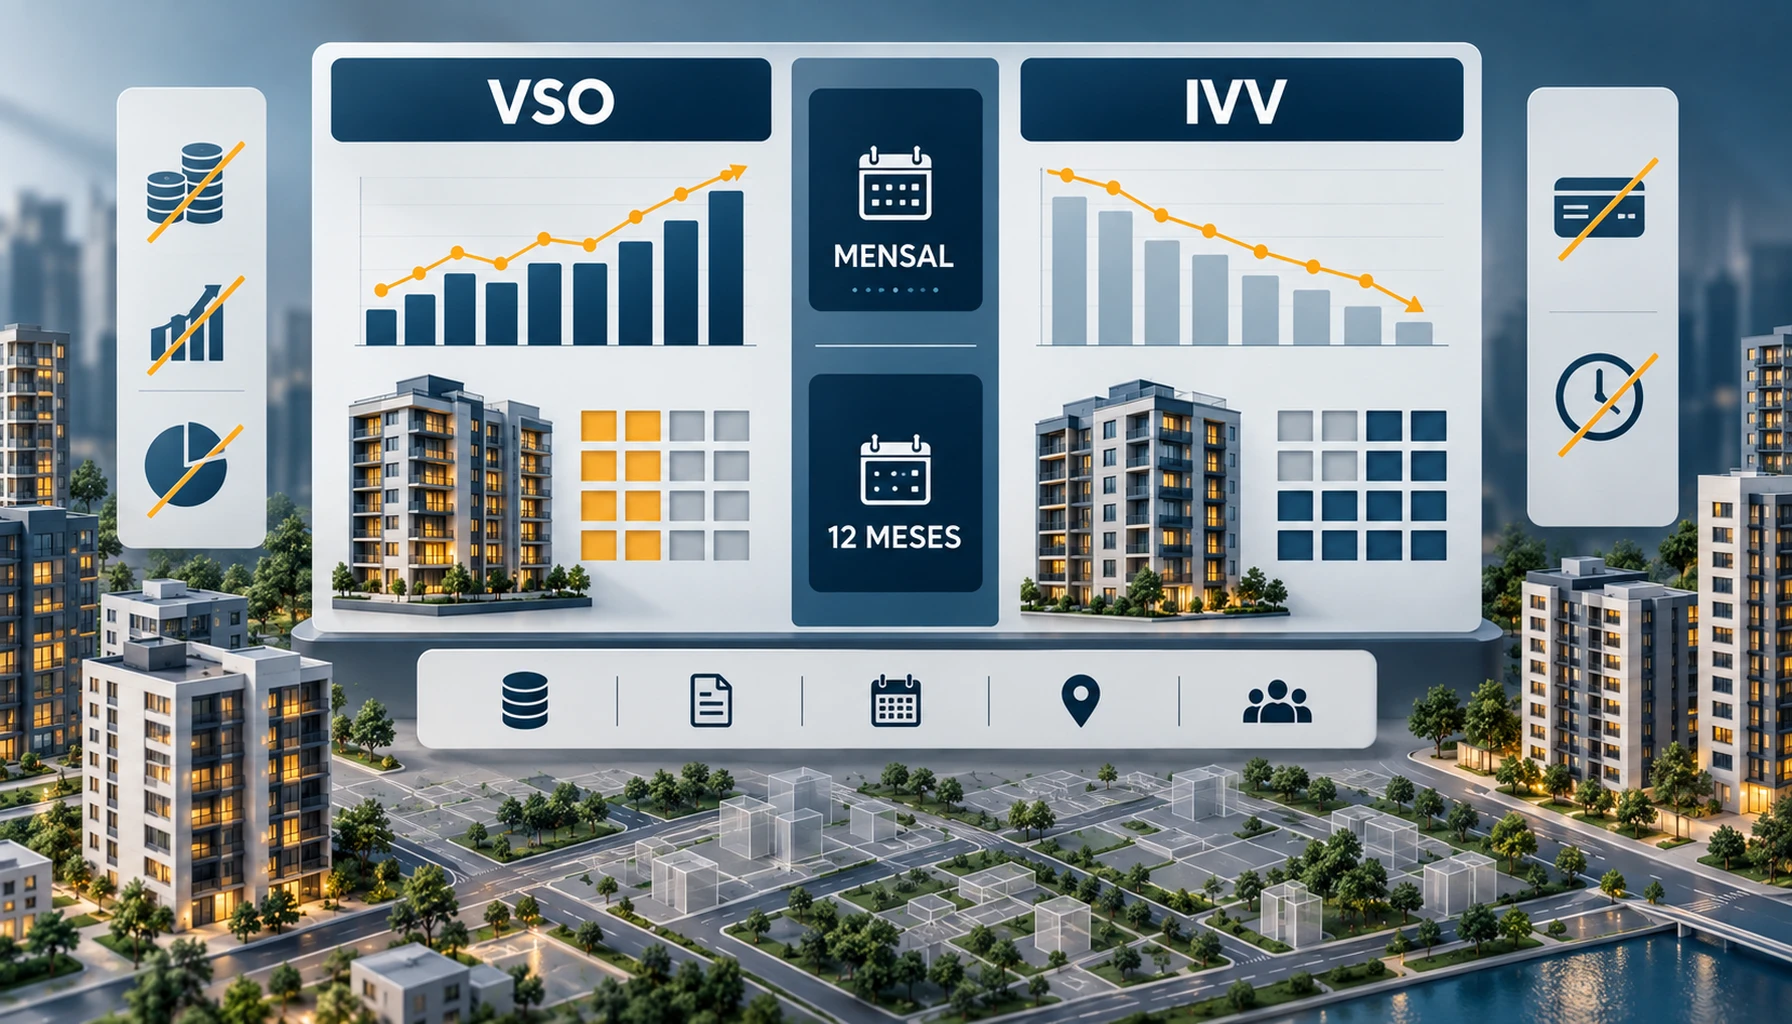
- Monthly and 12-month measures address different time frames.
- Unit-based indicators do not directly measure value, profitability or causation.
- Comparisons among institutions require methodological harmonization.
- Missing formulas or treatment rules should be recorded as unknown, not estimated.
What are VSO and IVV?
Brazilian property-market publications use VSO and IVV to connect sales activity with a supply base. Their exact definitions, however, come from each publisher's methodology. The primary material available for this article neither establishes one universal formula nor demonstrates that the labels are equivalent across institutions.
VSO: A sales-and-supply indicator whose exact meaning depends on the formula documented by its publisher.
IVV: A property sales indicator whose precise scope, denominator and period must be confirmed in the relevant publication.
Through CBIC/CII, the Câmara Brasileira da Indústria da Construção publishes national indicators covering launches, sales, supply and VSO. Its cited report, Indicadores Imobiliários Nacionais, 2T 2026, refers to the second quarter of 2026 and aggregates surveyed Brazilian markets. Yet the recovered material did not contain enough methodological detail to validate the complete formula, cancellation rules, rounding or treatment of missing data. This article therefore does not characterize the aggregate as a census of Brazil.
For Greater Vitória, the Sindicato da Indústria da Construção Civil no Estado do Espírito Santo, or Sinduscon-ES, publishes an IVV report based on research conducted directly with developers. The older PDF did not yield enough verifiable text to confirm the reference period, sample, formula, municipal coverage or handling of cancellations.
Secovi-SP, formally the Sindicato das Empresas de Compra, Venda, Locação ou Administração de Imóveis Residenciais ou Comerciais de São Paulo, lists launches, sales, final supply and VSO for new residential properties. The page focuses mainly on São Paulo city and includes certain indicators for the São Paulo Metropolitan Region. It confirms the existence and stated scope of those series, but not their formulas or complete methodology.
Start with the methodological note, not the acronym. For a broader introduction, see Sales Velocity (VSO/IVV): How to Measure Development Performance.
Are VSO and IVV the same indicator?
Are the two labels interchangeable? The available primary evidence does not show that they are universally identical. Although VSO and IVV may address related analytical questions, equivalence can be established only by comparing the definitions in the relevant sources and editions. Institutional use of both terms is not proof of formula-level identity.
CBIC and Secovi-SP demonstrably publish VSO series. Sinduscon-ES publishes IVV for Greater Vitória. This supports a factual observation about terminology, but it does not make the resulting percentages interchangeable.
Before comparing two series, verify:
- What qualifies as a sale and whether figures are gross or net of cancellations.
- Which inventory base enters the denominator.
- How launches and units withdrawn from supply are treated.
- Which property stages and segments are included.
- Whether the geography, sample and collection process are compatible.
- How missing observations, rounding and historical revisions are handled.
When a relevant field is unavailable, classify the comparison as unresolved. Do not close the gap with a formula copied from a search summary or an unrelated publication. The sources examined here did not validate generic formulas sometimes described as sales divided by sales plus supply, or sales divided by opening supply plus launches.
Should you use a monthly period or a 12-month period?
Follow the period defined by the published method. A monthly rate is intended to describe absorption during that month, whereas a documented 12-month measure covers its declared annual window. The two should not be compared directly until their denominators, aggregation methods and treatment of inventory changes are confirmed as compatible.

When is the monthly view useful?
For immediate monitoring, a monthly series is useful when its publisher applies a consistent monthly definition. It may flag a movement worth investigating.
It cannot explain the cause.
A given month might coincide with a launch, a change in reported supply, cancellations, commercial activity or a shift in the sample. Each is a hypothesis to test, not a conclusion supplied by VSO or IVV. Keep the numerator, denominator and source rules beside the chart.
When is a 12-month view useful?
Provided the source documents how the window is built, a 12-month series can reveal a broader trend. It is not automatically the monthly rate multiplied by 12.
No universal aggregation rule was verified in the reviewed documents. They also did not establish that every measure labeled “12 months” uses a rolling window. A report should state whether the measure is rolling, cumulative or constructed in another way. If the publication is silent, record the aggregation method as unknown.
Teams preparing forecasts should also read How to Estimate Unit Absorption Without Assuming History Will Repeat.
How should an analyst choose the indicator and source?
First match the publication to the decision's geography and time horizon. Then select an indicator only if its methodology is documented well enough for the intended analysis. A prominent national or regional series may still be unsuitable for a local development, while a familiar acronym is no substitute for auditing the underlying definition.
Use this five-step review:
- Define the decision. Distinguish immediate monthly monitoring from trend analysis covering as many as 12 months.
- Match the geography. CBIC aggregates surveyed Brazilian markets, Sinduscon-ES addresses Greater Vitória, and Secovi-SP mainly covers new residential properties in São Paulo city. One territory should not silently stand in for another.
- Retrieve the exact edition. Record its title, publisher, reference date and access date.
- Audit the method. Capture the formula, unit, numerator, denominator, frequency, sample, property stage, cancellation rules, supply withdrawals, launches, rounding, missing data and revisions.
- Decide comparability. If material fields differ or remain unknown, show the series separately and explain the limitation.
This review can form part of the routine described in Weekly Market Data for Real Estate Developers: Which Indicators Should You Track?.
For a market intelligence team, this distinction affects monthly reporting, development comparisons and 12-month trend analysis.
Talk to a specialist
Want to see this applied to your case?
Instead of finishing the article and staying in theory, send us your situation on WhatsApp. We reply with the concrete next step.
What do VSO and IVV not measure?
When both numerator and denominator count units, VSO and IVV do not directly measure monetary value, profitability, product quality, financing conditions, individual time to sale or causation. Reaching those conclusions requires separate indicators and documented assumptions. Financial and causal claims also need an appropriate analytical method.
Price, VGV and revenue
A unit ratio does not reveal the prices at which properties sold. Nor does it directly provide gross sales value, known in Brazil as VGV, or recognized revenue.
Even with similar reported sales ratios, two developments may differ in prices and unit mix. Price analysis therefore needs pricing and typology data, while VGV requires its own documented assumptions. Launch Pricing: How to Cross Price per m², Unit Type, Inventory and VSO Before Revising the Price List treats VSO as one input, not as a complete pricing decision.
Margin, profitability and return
Neither acronym demonstrates that a development is profitable. Costs, prices, payment timing and other financial assumptions all affect margin and return, yet they sit outside a unit-based sales indicator.
Converting a rate into revenue, payback or return demands explicit financial inputs and specialist review. Without them, the financial conclusion remains unsupported.
Credit, demand quality and causation
A change in VSO or IVV does not identify what caused it. Credit availability, buyer profiles, campaigns and product positioning may be plausible hypotheses, but the indicator alone cannot isolate any of them.
Causal statements require separate evidence and a suitable research design. Describing movement in an indicator is not the same as explaining that movement.

Individual time to sale
A flow-to-supply ratio is not automatically the average selling time of an individual unit. Converting it into a claim such as “the inventory will sell in a specified number of months” requires a validated model.
Such a model would need explicit assumptions about future sales, launches, cancellations and inventory changes. The cited sources do not support this conversion.
What should accompany VSO or IVV in a management report?
Each chart should provide enough provenance for another analyst to locate the exact edition, understand the intended method and identify any remaining unknowns. A concise audit box keeps the percentage connected to its geography, sample, denominator, period and rules for changes in available supply.
Include:
- publisher and exact report title;
- URL, publication or reference date, and access date;
- geography, property segment and sample;
- documented formula, numerator, denominator and unit;
- monthly, rolling or cumulative period definition;
- treatment of launches, cancellations and inventory withdrawals;
- rounding, missing-data and revision policies;
- an explicit limitations statement.
Complementary measures belong in the report only when they answer the question at hand. Price data serve price analysis, VGV data describe gross sales value, financial statements or feasibility models inform margin and return, and credit data address financing conditions.
What is the final decision rule?
Choose VSO when the selected source and edition define VSO for the market, period and decision being examined. Choose IVV when the relevant publication defines IVV and its methodology fits that decision. The acronym alone is not a selection criterion, and values should not be combined before their definitions are harmonized.
For monthly reporting, retain the monthly series with its exact rules. For a 12-month trend, rely only on the annual construction documented by the publisher. If essential details about the formula or treatment remain missing, the accurate conclusion is “not confirmed,” not an estimated definition.
No Imovitec CTA is included because the approved editorial brief contains no verified offer or supported next action for this audience and decision.
Sources and limitations
- Câmara Brasileira da Indústria da Construção, CBIC/CII, Indicadores Imobiliários Nacionais, 2T 2026, second-quarter 2026 reference period, accessed September 24, 2026. Scope: new-property markets in surveyed Brazilian areas. The full methodology was not recoverable, and the aggregate is not established here as a national census.
- Sinduscon-ES, with institutional support from ADEMI-ES, IVV, publication and reference dates unconfirmed, accessed September 24, 2026. Scope: Greater Vitória, based on direct research with developers. Formula, period and detailed treatment rules were not verified.
- Secovi-SP, Indicadores do Mercado, PMI, Pesquisa do Mercado Imobiliário, current page, accessed September 24, 2026. Scope: new residential properties, principally in São Paulo city, with some series for the metropolitan region. The complete formula and methodology were not exposed in the retrieved material.
FAQ
How do I calculate VSO correctly for a real estate report?
Calculate VSO only with the formula documented by the publication you are using. Before calculating, confirm the numerator, denominator, reporting period, geography, inventory treatment, launches, cancellations, withdrawn units, and revisions. The available CBIC and Secovi-SP records do not support presenting one generic VSO formula as a universal market standard.
What does VSO mean in the Brazilian real estate market?
VSO is an indicator associated with property sales and available supply, but its precise meaning depends on the publisher’s methodology. CBIC reports VSO alongside launches, sales, and supply, while Secovi-SP publishes VSO for new residential properties. Always retain the source’s definition, geographic scope, sample, and reference period.
What’s the difference between real estate IVV and the IVV ETF?
Real estate IVV and the IVV ETF are unrelated concepts that share an acronym. In Brazilian property research, Sinduscon-ES uses IVV for a Greater Vitória market indicator based on research with developers. In investment searches, IVV commonly refers to an exchange-traded fund. Confirm the context before interpreting, comparing, or calculating either measure.
What is a good VSO or IVV percentage for a development?
No universal percentage qualifies as a good VSO or IVV across every development or market. A defensible benchmark must use a comparable source, geography, property segment, project stage, period, and inventory methodology. Compare like-for-like series and examine their documented history instead of applying an unsupported threshold from another market or publication.
Should I use monthly VSO or a 12-month indicator?
Use monthly VSO for the reporting month and a documented 12-month measure for medium-term trend analysis. They answer different temporal questions and should not be compared directly. Confirm whether the longer measure is rolling or cumulative, how its denominator is constructed, and whether the publisher revised earlier observations before interpreting changes.
Can VSO or IVV demonstrate revenue, margin, or return on investment?
Unit-based VSO or IVV cannot directly demonstrate revenue, margin, profitability, payback, or return on investment. These ratios describe sales relative to a documented supply base, not financial value. Financial decisions require complementary evidence such as prices, VGV, costs, cash flow, cancellations, and recognized revenue, with each measure aligned to the same period and scope.
Can I compare VSO and IVV across CBIC, Secovi-SP, and Sinduscon-ES reports?
Cross-source comparison is valid only after methodological compatibility has been verified. CBIC, Secovi-SP, and Sinduscon-ES cover different geographies and may apply different samples, inventory definitions, sales treatments, and periods. Obtain the specific edition’s methodology and harmonize these fields before comparing results; otherwise, keep the series separate and disclose the limitation.
Talk to a specialist
Have a real case to solve?
Message Imovitec on WhatsApp. We reply fast and already speak your context — no forms, no waiting.
Frequently asked questions
How do I calculate VSO correctly for a real estate report?
Calculate VSO only with the formula documented by the publication you are using. Before calculating, confirm the numerator, denominator, reporting period, geography, inventory treatment, launches, cancellations, withdrawn units, and revisions. The available CBIC and Secovi-SP records do not support presenting one generic VSO formula as a universal market standard.
What does VSO mean in the Brazilian real estate market?
VSO is an indicator associated with property sales and available supply, but its precise meaning depends on the publisher’s methodology. CBIC reports VSO alongside launches, sales, and supply, while Secovi-SP publishes VSO for new residential properties. Always retain the source’s definition, geographic scope, sample, and reference period.
What’s the difference between real estate IVV and the IVV ETF?
Real estate IVV and the IVV ETF are unrelated concepts that share an acronym. In Brazilian property research, Sinduscon-ES uses IVV for a Greater Vitória market indicator based on research with developers. In investment searches, IVV commonly refers to an exchange-traded fund. Confirm the context before interpreting, comparing, or calculating either measure.
What is a good VSO or IVV percentage for a development?
No universal percentage qualifies as a good VSO or IVV across every development or market. A defensible benchmark must use a comparable source, geography, property segment, project stage, period, and inventory methodology. Compare like-for-like series and examine their documented history instead of applying an unsupported threshold from another market or publication.
Should I use monthly VSO or a 12-month indicator?
Use monthly VSO for the reporting month and a documented 12-month measure for medium-term trend analysis. They answer different temporal questions and should not be compared directly. Confirm whether the longer measure is rolling or cumulative, how its denominator is constructed, and whether the publisher revised earlier observations before interpreting changes.
Can VSO or IVV demonstrate revenue, margin, or return on investment?
Unit-based VSO or IVV cannot directly demonstrate revenue, margin, profitability, payback, or return on investment. These ratios describe sales relative to a documented supply base, not financial value. Financial decisions require complementary evidence such as prices, VGV, costs, cash flow, cancellations, and recognized revenue, with each measure aligned to the same period and scope.
Can I compare VSO and IVV across CBIC, Secovi-SP, and Sinduscon-ES reports?
Cross-source comparison is valid only after methodological compatibility has been verified. CBIC, Secovi-SP, and Sinduscon-ES cover different geographies and may apply different samples, inventory definitions, sales treatments, and periods. Obtain the specific edition’s methodology and harmonize these fields before comparing results; otherwise, keep the series separate and disclose the limitation.
Imovitec
Turn data into next steps.
Take the Imovitec diagnostic and see where your best opportunities are.