Neighborhood Appreciation: How to Separate Data from a Broker’s Narrative
“This neighborhood appreciated” sounds objective. It can, however, describe very different events. Asking prices may have increased, expensive units may have…
Imovitec · October 15, 2026
“This neighborhood appreciated” sounds objective. It can, however, describe very different events. Asking prices may have increased, expensive units may have gained weight in the sample, or comparable completed transactions may support a genuine rise in price per square meter.
Those interpretations are not interchangeable. A real estate market-intelligence team must decide whether the evidence is strong enough for an internal analysis or recommendation. That requires documented sources, consistent geographic boundaries, matching periods, comparable properties, disclosed sample sizes and explicit limitations.
Key takeaways
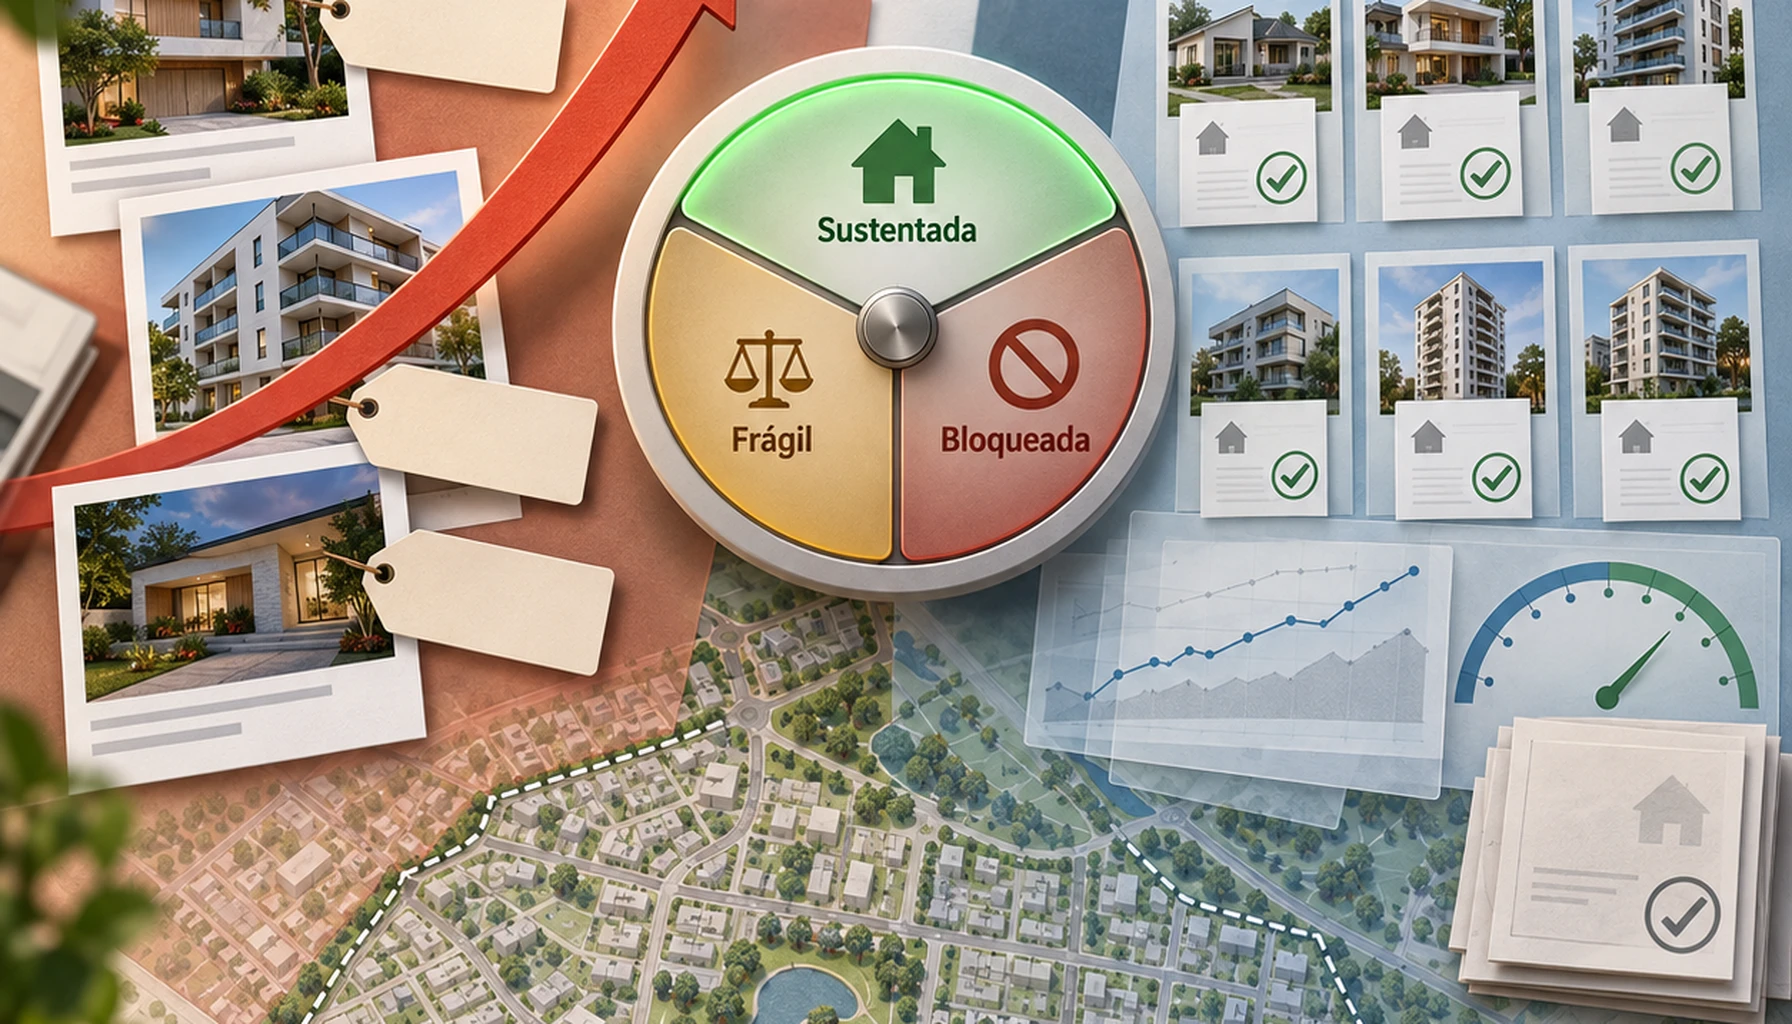
A defensible appreciation claim identifies the price metric, property universe, territory and period. It distinguishes listings from completed transactions, tests for changes in the property mix and reports nominal and inflation-adjusted movements separately. Missing sources, fields or denominators can make the correct conclusion “blocked.”
- Asking prices and completed transaction prices answer different questions.
- A rising average may reflect a different property mix rather than appreciation of comparable homes.
- Private, usable and total area cannot be mixed when calculating price per square meter.
- Sample size, exclusions, duplicates and missing fields belong in the conclusion.
- Infrastructure, credit and new developments are not proven causes without specific causal evidence.
- The final assessment can be supported, fragile or blocked.
What does neighborhood appreciation mean?
Neighborhood appreciation is an increase, over a defined period, in a specified price metric for comparable properties within a stable geographic boundary. A complete claim states which price was measured, which properties were included, where the boundary lies and which initial and final dates were used.
A phrase such as “median apartment asking price per private square meter within the defined neighborhood boundary between two stated months” is auditable. “The neighborhood is booming” is not.
Concise definition: Neighborhood appreciation is a measured price increase for comparable properties in a fixed area over a stated period.
Price per square meter equals the property price divided by the area recorded for that property. The area may be private, usable or total, depending on the source. Mixing these concepts invalidates the comparison.
Records with null, negative or incompatible areas must be reviewed or excluded. The final analysis should identify the adopted area concept, state the unit as currency per square meter and disclose exclusions. Rounding should occur only after division.
The median is the central observation after valid price-per-square-meter values are ordered. When the sample contains an even number of records, it is the mean of the two central observations. The valid sample size must accompany the result.
Why are asking prices not proof of completed transaction prices?
An asking-price series describes how sellers advertise properties within the source’s coverage. It does not, by itself, establish the amount accepted in completed transactions. That distinction affects the meaning of the metric and the confidence that an analyst may assign to an appreciation claim.
The research package identifies Fundação Instituto de Pesquisas Econômicas and FipeZAP as candidates for verifying the methodology of a residential asking-price index. It did not recover an exact publication title, direct URL, reference month or methodological page. No FipeZAP figure or coverage statement is therefore publishable from this package.
Listings remain useful. They can describe the advertised competitive set, seller expectations and changes in active supply. They cannot be relabeled as completed transactions. The same distinction applies to a developer’s price table, as discussed in List Price Is Not Realized Price.
Municipal property-transfer tax records may bring an analysis closer to completed deals, but this is a methodological possibility rather than a nationwide rule. The competent municipality must document each field and the covered universe.
A tax base may differ from the contractual price. Exemptions, revisions, cancellations, duplicate records, confidentiality rules and data quality may also vary. Municipal documentation and legal review are necessary before those records support a conclusion.
How can a change in property mix imitate appreciation?
A neighborhood series may rise without comparable homes appreciating when the observed sample shifts toward newer, larger, better-located or higher-specification units. This is a composition effect. It changes the aggregate result without isolating a like-for-like change in property values.
Consider one period dominated by older compact apartments and another containing many new premium units. A higher average in the second period does not reveal what happened to comparable apartments. The observed difference combines price movement with a changed sample.
At minimum, the comparison should control or segment by:
- Property type and relevant unit configuration
- Area definition and size band
- New development or existing stock
- Stable geographic boundary
- Record type, such as listing or transaction
- Matching reference periods
- Source and collection method
Renaming or redrawing a neighborhood changes the observed universe. The boundary must remain stable, or the effect of the change must be documented.
Instituto Brasileiro de Geografia e Estatística census and urban-environment data may provide territorial context. The supplied research, however, did not recover a specific publication, date or URL. Census data are not necessarily annual, so temporal compatibility must also be assessed.
For a relative-location decision, use a controlled framework such as How to Compare Two Neighborhoods Before Choosing Where to Launch a Development. Keep each source’s universe separate throughout the comparison.

Which calculations belong in an appreciation audit?
An appreciation audit should preserve each source’s metric, unit, denominator, period and scope. Percentage change, compound annual growth, real change, observed volume and liquidity measure different things. They should be calculated and reported separately, with their assumptions and exclusions beside the result.
Percentage change
Percentage change is the ending value divided by the starting value, minus one, then multiplied by 100. Both values must come from the same metric and source. The result is a percentage, and the starting value is its denominator.
State the initial and final reference periods, the rounding rule and any removed or imputed periods. Do not fill gaps silently. For a published composite index, calculate the change from the two published index levels rather than averaging changes across properties or neighborhoods.
Compound annual growth rate
Compound annual growth rate, or CAGR, is the ending value divided by the starting value, raised to the inverse of the documented number of years, minus one, then multiplied by 100. Its unit is percentage per year.
The starting value must be positive. The elapsed time must use exact years or a documented fraction of a year. Missing reference periods cannot be filled without a declared method.
Percentage change is the ending value divided by the starting value, minus one, then multiplied by 100.
Inflation-adjusted change
Accumulated real change is one plus nominal appreciation, divided by one plus accumulated inflation, minus one. Nominal appreciation and inflation must cover the same starting and ending dates. Calculate the result before rounding and report it as a real percentage.
The package identifies the Instituto Brasileiro de Geografia e Estatística’s Extended National Consumer Price Index, known in Brazil as IPCA, as the primary series to verify. It does not provide the applicable series, title, URL, reference period or methodology. This article can state the method, but it cannot publish an inflation-adjusted result.
Before a case study is released, verify the selected index, base, territorial coverage, revisions and matching window. Do not combine a monthly asking-price observation with inflation accumulated over different dates.
Observed volume and liquidity
Observed volume is the number of valid records remaining after declared filters. Its unit must identify whether the records are listings, transactions or another record type. Report duplicates, cancellations and observations missing essential fields that were removed.
Liquidity has no valid formula until it receives an operational definition. It might mean transaction count, time on market or a sales-to-offer ratio. Each choice requires its own denominator, period and comparable exposure. Volume alone is not liquidity.

Talk to a specialist
Want to see this applied to your case?
Instead of finishing the article and staying in theory, send us your situation on WhatsApp. We reply with the concrete next step.
Can VSO, IVV or launch data prove neighborhood appreciation?
No. Launches, sales, supply, Sales over Supply, known as VSO in Brazil, and the Sales Speed Index, often called IVV, describe specified market flows. They do not automatically measure appreciation in a neighborhood’s existing residential stock. Universe, geography, denominator and period must be checked first.
Publications from Associação Brasileira de Incorporadoras Imobiliárias, Câmara Brasileira da Indústria da Construção or a local entity may cover the primary market, participating developers or selected cities. They may not represent every transaction in a neighborhood.
The evidence package contains no verified report title, direct URL, reference date or methodology from those organizations. It therefore supports no numerical claim based on their indicators.
VSO and IVV must retain the definitions used in their respective publications. They are not universal synonyms and should not be converted into appreciation metrics. See VSO vs. IVV: Which Indicator to Use, for What Period, and What Neither Measures.
Did a metro station, new project or cheaper credit cause the increase?
A temporal association does not prove that infrastructure, zoning, security, a shopping center, mortgage credit or interest rates caused neighborhood appreciation. A causal conclusion requires evidence that addresses competing explanations, timing differences and changes in the properties observed during the same period.
Banco Central do Brasil is the indicated primary source for Selic and real estate credit series. Associação Brasileira das Entidades de Crédito Imobiliário e Poupança publishes sector financing statistics. The package contains no verified series codes, direct URLs, reference dates or methodological notes from either source.
No rate, credit volume or causal conclusion should be inserted without those records. Macroeconomic indicators may provide context, but they do not independently explain a neighborhood-level movement.
Infrastructure also requires precise dates. An announcement, construction start and completed operation are distinct events. None guarantees appreciation, and a historical association cannot support a guaranteed-return statement.
Future returns remain unknown. Any forecast would require explicit assumptions, verified inputs and financial review.
How do you audit an appreciation claim step by step?
A reliable audit moves from source identity to comparability, calculation and decision. The analyst first defines the claim, then checks the records and methods needed to support it. If a critical source, period, field or denominator cannot be verified, the claim must be narrowed or blocked.
- Define the decision, metric, territory and period before examining the result.
- Classify every record as a listing, completed transaction, tax record or sector indicator.
- Record the publisher, exact title, direct URL, publication date, reference period, coverage and methodology.
- Keep property type, area definition and geographic boundary comparable.
- Remove or flag duplicates, cancellations, missing fields and incompatible areas.
- Report the valid sample size and all material exclusions.
- Calculate median and average separately when both are useful.
- Calculate nominal change with matching endpoints.
- Calculate real change only with a verified inflation series covering the same window.
- Test whether the conclusion survives segmentation and composition controls.
- Separate observed association from causal explanation.
- Assign an evidence status and state its implication for the decision.
Use one of three final statuses:
- Supported: Documented primary sources, comparable observations and declared methods support a narrowly worded claim.
- Fragile: Evidence points in the same direction, but sample, composition, coverage or period limits prevent a firm conclusion.
- Blocked: A critical source, field, denominator, period or methodological condition is missing.
This process complements Real Estate Appreciation: How to Separate Verifiable Data from a Broker’s Guess.
What can the current evidence package support?
The current package supports an audit method, but it does not establish that any named neighborhood appreciated by a particular amount. Exact primary documents, direct URLs, dates, series and local records were not recovered. Numerical appreciation claims and neighborhood rankings therefore remain blocked.
The package also cannot support completed-price claims derived only from listings, causal stories about local change or future-return forecasts. Those conclusions require evidence that is absent here.
That boundary is useful. Market intelligence should stop a persuasive narrative from becoming an unsupported recommendation. Publication of a numerical case study must wait until the primary documents and local records are verified.
FAQ
How do I know whether a neighborhood has really appreciated?
Genuine neighborhood appreciation requires comparable price evidence across a clearly defined area and consistent period. Identify whether records represent listings or completed transactions, use the same price metric, disclose sample size and filters, and check for changes in property mix. Without those controls, a higher average may reflect composition rather than appreciation.
What does real estate appreciation mean?
Real estate appreciation is an increase in a consistently measured property value indicator over a stated period. The claim must specify the geography, property segment, price measure and data source. Nominal appreciation should also be distinguished from inflation-adjusted change, while any conclusion about future returns must be treated separately and supported by explicit assumptions.
How do I calculate a property's appreciation rate?
Calculate appreciation as ((P1 ÷ P0) − 1) × 100, using comparable values from the same metric and source. P0 is the initial value and P1 the final value. Match the dates and property characteristics, disclose missing observations, and do not compare listing prices at one endpoint with transaction records at the other.
What's the best way to assess a neighborhood's appreciation potential?
The best assessment separates observed historical change from future potential. First audit comparable properties, territorial boundaries, periods, inflation, sample size and record type. Then evaluate prospective factors as hypotheses, not proof. Infrastructure, zoning or credit conditions may coincide with price changes, but they do not establish local causation or guarantee future appreciation.
Which metrics should I compare when evaluating neighborhood appreciation?
Compare median price per square meter, sample size, record volume and nominal versus inflation-adjusted change as separate measures. Mean, median, CAGR and liquidity answer different questions and should not be substituted for one another. Define the area measure used, document duplicate removal and avoid calling transaction volume liquidity without a comparable denominator.
Is a rigorous neighborhood appreciation analysis worth the cost?
A rigorous analysis is worthwhile when a weak claim could distort an internal recommendation or investment decision. Its value comes from reducing decision risk, not guaranteeing returns. Scale the work to materiality: verify sources and comparability first, then add inflation, sensitivity or causal analysis only when those refinements could change the decision.
Can listing data alone prove that a neighborhood appreciated?
Listing data alone cannot prove that completed transaction prices increased. It can support a clearly labeled analysis of asking-price trends when coverage, periods, filters and sample composition are documented. For stronger conclusions, seek transaction evidence where available and validate its local definitions, because tax records and municipal datasets may have jurisdiction-specific limitations.
Talk to a specialist
Have a real case to solve?
Message Imovitec on WhatsApp. We reply fast and already speak your context — no forms, no waiting.
Frequently asked questions
How do I know whether a neighborhood has really appreciated?
Genuine neighborhood appreciation requires comparable price evidence across a clearly defined area and consistent period. Identify whether records represent listings or completed transactions, use the same price metric, disclose sample size and filters, and check for changes in property mix. Without those controls, a higher average may reflect composition rather than appreciation.
What does real estate appreciation mean?
Real estate appreciation is an increase in a consistently measured property value indicator over a stated period. The claim must specify the geography, property segment, price measure and data source. Nominal appreciation should also be distinguished from inflation-adjusted change, while any conclusion about future returns must be treated separately and supported by explicit assumptions.
How do I calculate a property's appreciation rate?
Calculate appreciation as ((P1 ÷ P0) − 1) × 100, using comparable values from the same metric and source. P0 is the initial value and P1 the final value. Match the dates and property characteristics, disclose missing observations, and do not compare listing prices at one endpoint with transaction records at the other.
What's the best way to assess a neighborhood's appreciation potential?
The best assessment separates observed historical change from future potential. First audit comparable properties, territorial boundaries, periods, inflation, sample size and record type. Then evaluate prospective factors as hypotheses, not proof. Infrastructure, zoning or credit conditions may coincide with price changes, but they do not establish local causation or guarantee future appreciation.
Which metrics should I compare when evaluating neighborhood appreciation?
Compare median price per square meter, sample size, record volume and nominal versus inflation-adjusted change as separate measures. Mean, median, CAGR and liquidity answer different questions and should not be substituted for one another. Define the area measure used, document duplicate removal and avoid calling transaction volume liquidity without a comparable denominator.
Is a rigorous neighborhood appreciation analysis worth the cost?
A rigorous analysis is worthwhile when a weak claim could distort an internal recommendation or investment decision. Its value comes from reducing decision risk, not guaranteeing returns. Scale the work to materiality: verify sources and comparability first, then add inflation, sensitivity or causal analysis only when those refinements could change the decision.
Can listing data alone prove that a neighborhood appreciated?
Listing data alone cannot prove that completed transaction prices increased. It can support a clearly labeled analysis of asking-price trends when coverage, periods, filters and sample composition are documented. For stronger conclusions, seek transaction evidence where available and validate its local definitions, because tax records and municipal datasets may have jurisdiction-specific limitations.
Imovitec
Turn data into next steps.
Take the Imovitec diagnostic and see where your best opportunities are.